
Master Microsoft Excel with Us!
Join our hands-on Excel course and unlock powerful tools for data analysis, reporting, automation, and business efficiency.

Learn Excel in 2025: Essential Skills for Any Career
Excel remains the most widely used tool for data management, financial modeling, and business reporting. Whether you're in finance, marketing, operations, or HR—Excel proficiency is a must-have.
-
Beginner-Friendly
Start with the basics: formatting, formulas, and functions explained simply.
-
Powerful Features
Master PivotTables, VLOOKUP, charts, and automation with Excel macros.
-
Workplace Essential
Excel is a required skill across industries—from entry-level to executive roles.

Get Hands-On with Real Excel Projects
Our Excel course gives you practical experience in building dynamic reports, automating workflows, and analyzing data like a pro.
- Create dashboards, reports, and templates for real-world use
- Gain skills in Excel formulas, charts, and financial models
- Certificate of completion & portfolio-worthy projects

No Experience? No Problem!
Designed for absolute beginners, our Excel course starts from scratch and guides you all the way to advanced skills.
- Step-by-step lessons with guided exercises
- Engaging examples and practice spreadsheets
- Build confidence to use Excel in any job role
Course Syllabus Overview
This is a brief overview of the syllabus. For more detailed information on each topic, please download the full syllabus.
Download Full SyllabusModule 1: Excel Essentials
1.1: Excel Interface & Navigation
Understand the layout, menus, and toolbars to navigate Excel confidently.
1.2: Workbook & Worksheet Basics
Learn how to create, save, and manage workbooks and worksheets.
1.3: Basic Data Entry
Enter, edit, and delete data efficiently in Excel cells.
1.4: Saving & Sharing Files
Discover best practices for saving, exporting, and sharing Excel files.
Module 2: Data Entry & Formatting
2.1: Cell Formatting
Apply font, color, borders, and number formats to enhance readability.
2.2: Row & Column Management
Insert, delete, resize, and move rows and columns for better organization.
2.3: Data Validation
Set rules to control the type of data entered in cells.
2.4: Conditional Formatting
Highlight data automatically based on specific criteria.
Module 3: Formulas & Functions
3.1: Basic Formulas
Perform arithmetic operations using Excel formulas.
3.2: Common Functions
Use SUM, AVERAGE, COUNT, MIN, and MAX for quick calculations.
3.3: Relative & Absolute References
Understand how cell references work in formulas.
3.4: Error Checking
Identify and fix common formula errors.
Module 4: Data Management & Organization
4.1: Sorting & Filtering
Organize data by sorting and applying filters for quick analysis.
4.2: Tables & Structured References
Convert ranges to tables for easier data management.
4.3: Find & Replace
Quickly locate and update data within your worksheets.
4.4: Data Cleaning
Remove duplicates and handle blank or inconsistent entries.
Module 5: Data Visualization & Reporting
5.1: Creating Charts & Graphs
Build bar, line, pie, and other charts to visualize data trends.
5.2: Customizing Visuals
Modify chart elements like titles, legends, and colors for clarity.
5.3: Using Sparklines
Add mini-charts within cells for quick visual summaries.
5.4: Building Summary Reports
Compile and present key insights from your data.
Module 6: Advanced Tools & Automation
6.1: PivotTables & PivotCharts
Summarize and analyze large datasets with interactive tables and charts.
6.2: What-If Analysis
Use tools like Goal Seek and Scenario Manager for forecasting.
6.3: Basic Macros
Record and run simple macros to automate repetitive tasks.
6.4: Integrating AI Tools
Explore Excel’s latest AI-powered features for smarter data analysis.
💥 Limited-Time Discounts on Tech Courses!
Grab your spot and save big on the skills that matter.
🎓 School Student Deal – 30% OFF
Get 30% off beginner-friendly coding, web, and STEM courses! Start your tech journey today.
Get Offer🏫 College Exclusive – 25% OFF
Advance your tech skills with 25% off specialized software and data courses built for college students.
Claim Deal👥 Group Deal – Save up to 40%
Join with 3+ friends and unlock up to 40% in savings! Study together, succeed together.
Join Now⚡ Flash Sale – 50% OFF (24 Hrs!)
Enjoy a massive 50% off any course for the next 24 hours. Don’t miss out!
Special offerExcel Interview Questions
Prepare for interviews or brush up your spreadsheet skills with these Excel interview questions. Covers fundamentals, data formatting, formulas, visualization, and automation.
1.1 What are the key components of the Excel interface, and how do they assist in data analysis?
1.2 How do workbooks and worksheets differ in structure and usage?
1.3 What are the different file formats available for saving Excel files and their typical use cases?
1.4 What are the steps involved in saving and sharing an Excel file securely?
1.5 How can keyboard shortcuts improve navigation and efficiency in Excel?
2.1 How do you apply conditional formatting and what are some real-world examples?
2.2 What is the purpose of data validation and how does it enhance data integrity?
2.3 How do you format cells to show percentages, currencies, and custom formats?
2.4 What are the best practices for resizing and organizing rows and columns?
2.5 How does cell formatting affect readability and data presentation?
3.1 What is the difference between using a formula and a function in Excel?
3.2 How do you apply the SUM, AVERAGE, and COUNT functions?
3.3 How do absolute and relative references differ in formulas?
3.4 What common errors occur in formulas and how can they be resolved?
3.5 How does Excel’s formula auditing feature help in troubleshooting complex sheets?
4.1 What is the difference between sorting and filtering data in Excel?
4.2 How do structured references in tables make formulas more manageable?
4.3 What is the role of the Find & Replace tool in large datasets?
4.4 How can duplicates be identified and removed effectively?
4.5 What strategies can be used to clean inconsistent or missing data?
5.1 How do you choose the most appropriate chart type for your data?
5.2 What are the components of a chart that can be customized for clarity?
5.3 What is the use of sparklines and how do they help in quick analysis?
5.4 How do you compile data summaries using pivot charts or tables for reporting?
5.5 What are best practices for designing a clear and professional Excel report?
6.1 How do PivotTables help in summarizing large datasets?
6.2 What is the use of Goal Seek in what-if analysis, and give an example?
6.3 What is a macro in Excel, and how can it be used to automate tasks?
6.4 How does Scenario Manager assist in decision-making?
6.5 What are some practical applications of AI-powered features in Excel?
Excel Project Ideas
A collection of practical and business-relevant Excel projects to help you apply your skills in data analysis, reporting, and automation.
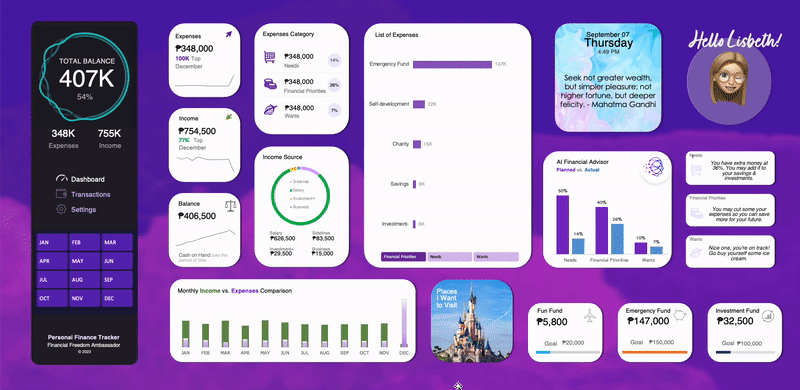
Personal Budget Tracker
A simple, interactive budget spreadsheet.Create a monthly budget tracker that records income and expenses, calculates totals, and highlights overspending using formulas and conditional formatting.
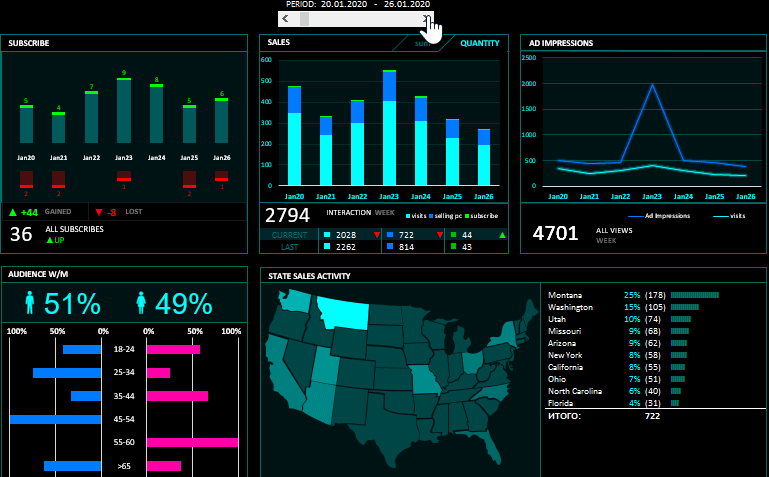
Sales Data Dashboard
A dynamic sales analysis tool.Build a dashboard that organizes sales data, summarizes key metrics with PivotTables, and visualizes trends using charts and slicers.
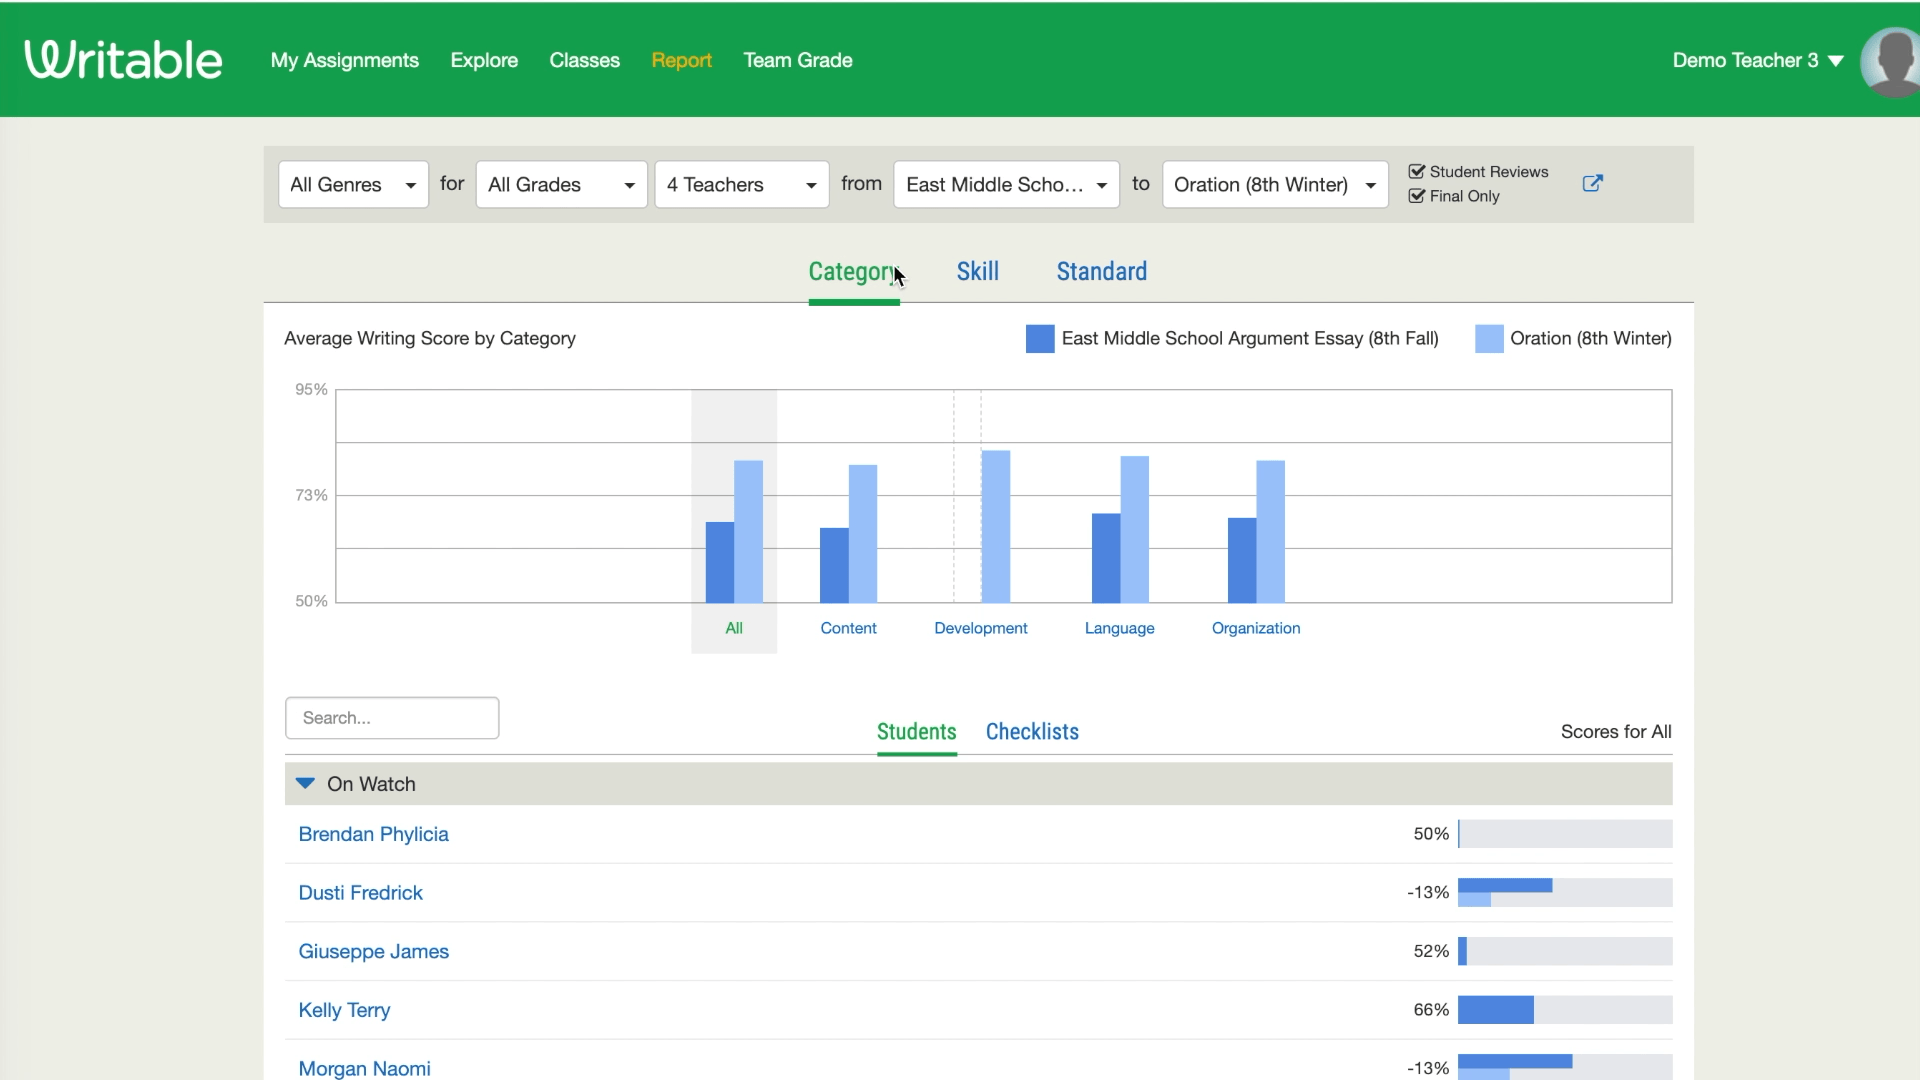
Student Performance Report
An automated gradebook for student scores.Design a gradebook that calculates averages, highlights top performers, and generates summary reports for each student with charts and conditional formatting.